The Organizational Theory
Organization Ontology
A good friend of mine, Brian Lee, developed a theory of organizational alignment from first principles. His original name for the concept was The Organization Ontology. It was called an Ontology because he had identified a specific “inventory” of subsystems that are in operation in any organization regardless of whether or not they are identified and managed by the organization’s leadership. By making the list of subsystems visible to management, they can intentionally create each one and thereby cause the organization to fall into greater alignment and, from that, become significantly more agile.
The Organization Ontology has many aspects and I won’t try to do it justice here. We’re all waiting for Brian to write the definitive treatise on it. I will, however, focus on one aspect of the Ontology which we all lovingly refer to as “The Cube”.
1. Design is the manner in which function arises from structureThe Cube2. Strategy is the way infrastructure is applied through action to accomplish change.
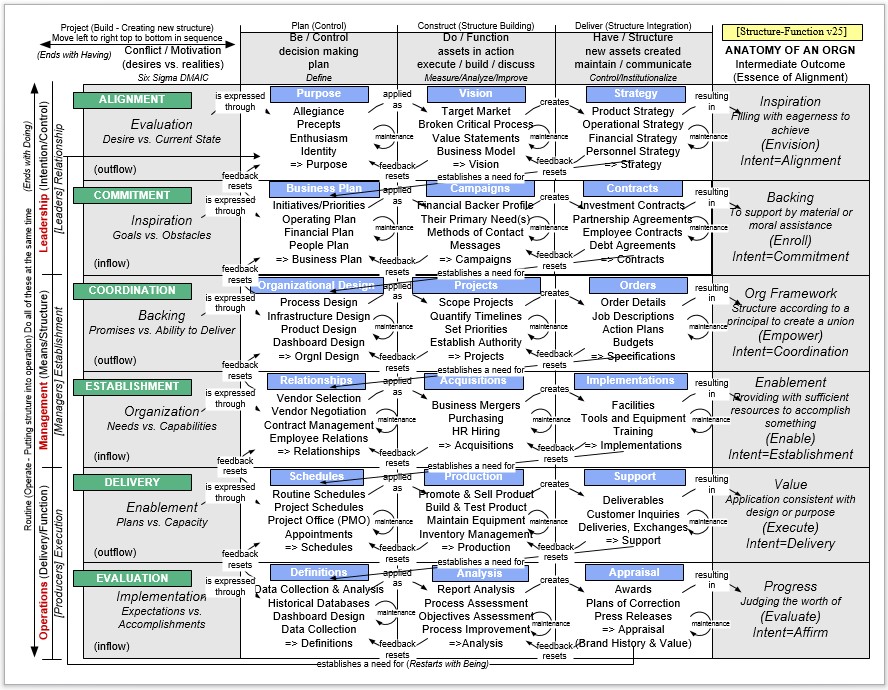
The essential ontology of an organization can be captured in a simple diagram. This diagram reflects the roles, responsibilities, and relationships of the major organizational systems. It is a design pattern that should be followed to create an effective high performance organization. It is a fractal pattern since each subsystem within each system will have the same essential ontology.
This simple diagram, known as The Cube, is a grid which contains the primary ontological elements of an organization. It is broken into rows which represent the essential systems of an organization and a set of columns which represent the way these subsystems Be, Do, and Relate to one another to produce the organization.
Structure-Function
After working with Brian on the initial implementation of O2 (as we called it), I went off on my own and began to apply it to whatever organization I was working with. As an architect, I felt compelled to have a foundation for The Cube that went beyond simply “because Brian said so”. I worked with the grid and tried to integrate additional activities into it. I tried to find reasons behind the sequence and connections between the flows. Eventually, I came to an astonishing conclusion. During my days as a molecular biologist I worked with enzymes on what is referred to as the Structure-Function Problem. That is, based on the structure of a protein, how can you determine what the function is? I had always taken it as given that structure and function were related one to another. Working with the grid I suddenly realized that there was actually something missing from this equation.
Structure, when put into action (that is, when controlled), creates function. You have to swing the hammer to pound a nail. You have to operate the scissors to cut paper. Conversely, if you properly control some function, you can create new structures with it. Scissoring can be used to create paper dolls. Hammering can be used to build walls. It isn’t structure-function. It is structure-control-function and function-control-structure. Control of structure creates functionality. Control of function yields new structure.These are the three columns of the grid. Being – what principles you operate under is control. Doing – the operations you perform is function. Relating – what you hope to accomplish is new structure.
An understanding of this expanded relationship leads directly to two novel observations:
1. Design is the manner in which function arises from structure.
2. Strategy is the way infrastructure is applied through action to accomplish change.
Essential Subsystems
The rows of the grid, like the columns, are also composed of Structure, Control, and Function. In my version of the model there are 6 rows. The first two rows represent Control. In the first row (the Leadership subsystem) you Be-Do-Relate to inspire people. You create an identity, vision, and strategy that makes people want to be a part of your organization. In the second row (the Ownership subsystem) you Be-Do-Relate to convince people to back your organization. You put out vision and get back commitment.
The middle column of the grid is function being controlled to produce structure. However, the middle two rows of the grid represent structure being controlled to produce function. The third row (the Planning subsystem) is where you Be-Do-Relate to create the organization. You put out organizational designs, plans, and authority to lay the foundation for the organization. These are the first real operational structures in the organization. In the fourth row (the Management subsystem) you decide what to purchase and who to hire to actually create the organization.You spend the commitment and bring in the essential elements to business operation.
The final two rows of the grid represent putting structure to work to create function. In the fifth row (the Operations subsystem) you use the organization to create the product or service that represents the output of the organization. The last row (the Reporting subsystem) you input the data and review the effects of your work and then analyze what you need to change.
After that you repeat the cycle again changing anything that is needed to help the organization thrive.
The 6E’s
If you condense each of the rows into a single term that represents the goal or intent of each row, you get a formula for creating an organization:
1. Envision – you have to start by envisioning the organization and inspiring people to join it.
2. Enroll – you have to sell your vision and get people to make commitments to its success.
3. Empower – you have to design the organization and authorize it to function.
4. Enable – you have to obtain the necessary tools, equipment, and people to enable the organization to operate.
5. Execute – once you have the tools, equipment, and people, you have to execute the vision.
6. Evaluate – you have to look back at what you did and realistically assess what you did right and what you
did wrong and then make changes that ensure the future success of the organization.
This is how you build, assess, and manage an organization.
The Design Syntax
Miryid
The Organization Ontology contains a step to “Design The Organization”. We tried using a number of diagramming techniques but each of them failed to capture the full set of Structure – Control – Function needed to fully explain any organizational operation. So, to get around this problem, I created a new approach to designing processes and gave it the name Miryid (pronounced MEAR-ee-id). Miryid is not the name of the Organization Ontology. It is the name of the process design syntax and is the IP that I have contributed to this area.
Every activity and control flow notation that I am aware of can be seen as a subset of this notation easily created by the removal of design elements.IDEF0
Activity Diagrams are commonly used but they have issues. They either display flow of control information or they display flow of material information but they cannot display both. So I went searching for an appropriate syntax. During that search I found IDEF0. IDEF0 diagrams have a control arrow that comes into the top so you can model a workflow that creates the elements that control another workflow and you have material flow elements which show you what the workflow steps do. There is only one problem with this notation. When you model controls flows it isn’t enough to know just what the control elements are. You have to start an activity and signal the end of an activity so that remote activities can be synchronized. Control decomposes into Start, Change, and Stop. Each of these are needed in the syntax.
The Octagon
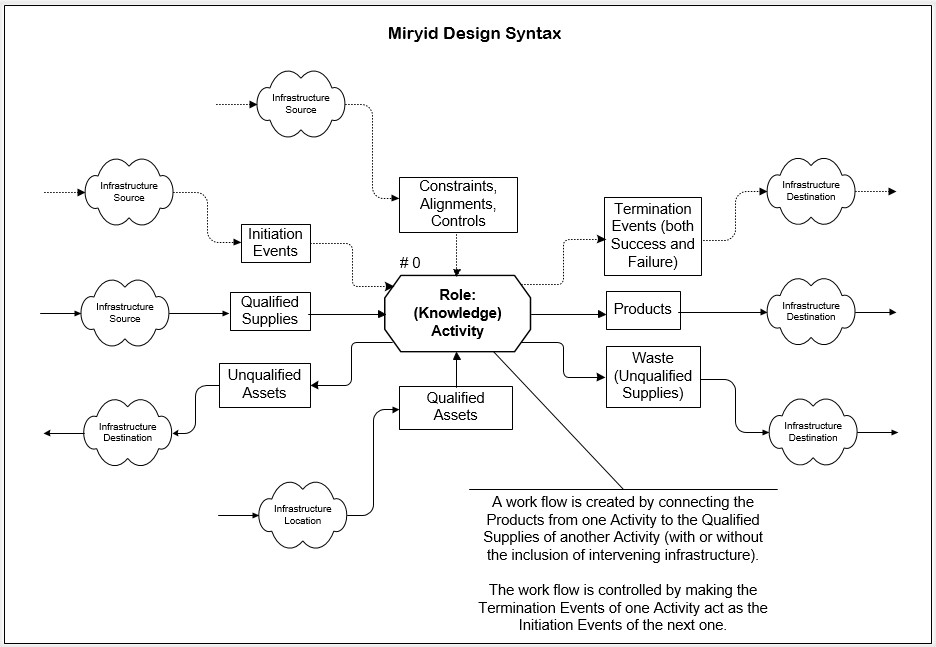
If you take the IDEF0 rectangle and replace it with an octagon you have all of the surfaces that you need to properly model an activity with inputs and outputs and the control elements that start the activity, limit the activity, and signal the activity’s end. Control elements can be chained so that the ending signal from one activity becomes the starting signal for another activity and inputs and outputs can be chained (using the left and right side of the octagon) to show the flow of material through the process.
The bottom three sides are used for elements that are primarily necessary when diagramming manufacturing processes. The lower right face is used to indicate any waste that is created by the activity. This allows the workflows that handle waste to be diagrammed and integrated with the main production workflow. The bottom face is used to indicate any equipment that is needed to perform the activity (such as a lathe). Equipment is assumed to be in fully operational order. If as a result of the activity, the equipment moves to a non-operational state (for example 3,000 hours of use between maintenance activities) the lower left face is used to diagram the workflow that restores the equipment to fully operational condition. In our terms the bottom face is for Qualified Assets and the left lower face is for Unqualified Assets.
We used dotted lines to connect control flows and solid lines to connect material flows. We also added an element between activities to represent a stocking location into which activity outputs can be stored between operations. This allows for the creation of stock and flow diagrams. I also encase large sections of process diagrams in an enclosing rectangle to represent a facility so that distributed workflows can be modeled. Activities are named by taking the role that performs the activity followed by a colon and then the name of the activity as a verb phrase (as in AP_Clerk: Write Check).
Every activity and control flow notation that I am aware of can be seen as a subset of this notation easily created by the removal of design elements. This syntax also allows publish/subscribe and event models to be easily created and documented.